
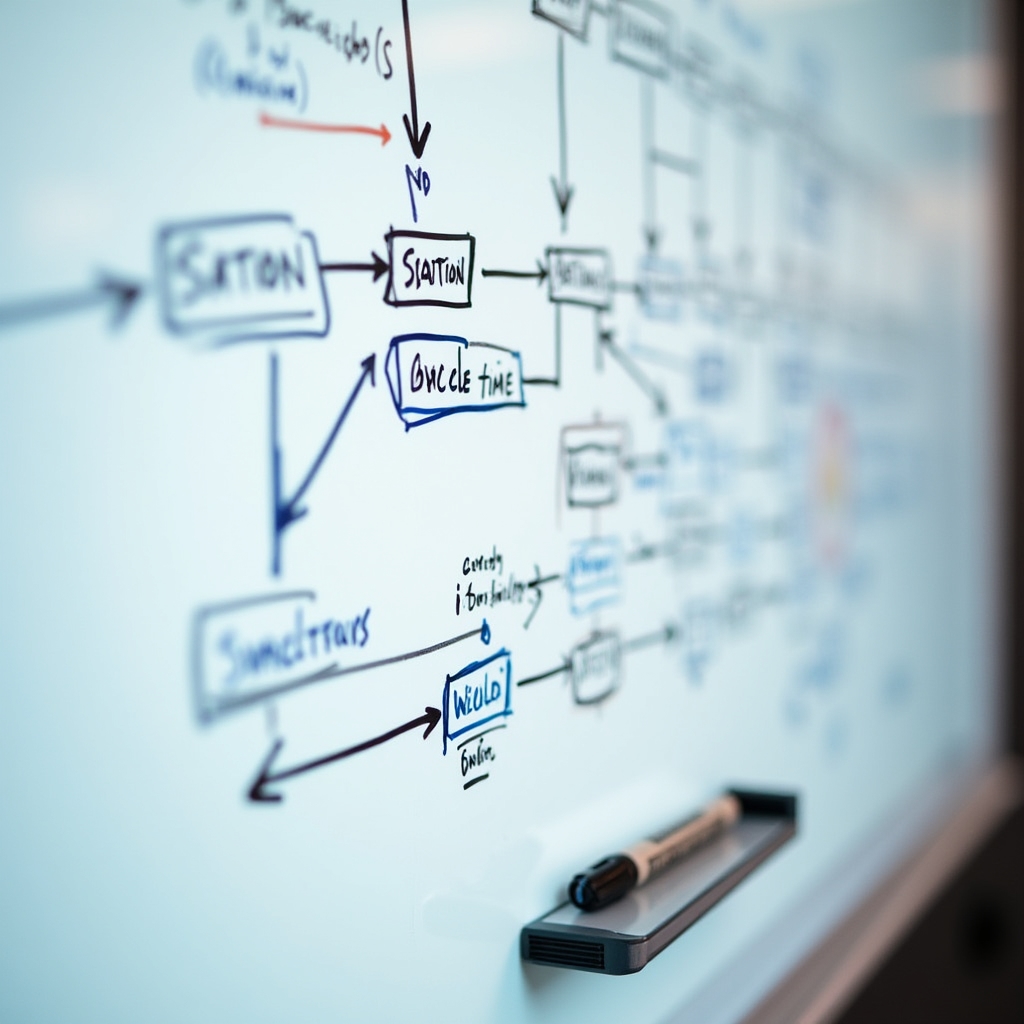
Why a whiteboard, not a screen
A production line has a rhythm that rarely matches the diagram in the operations manual. Machines get worked around, informal double-checks get added after a bad batch, and a shared resource ends up doing more than its share. None of that shows up in a flowchart made by someone sitting in an office. It shows up when the people running the stations draw it themselves.
That is the entire reasoning behind starting with a whiteboard rather than software. A blank surface and a set of markers put the drawing in the hands of operators and shift leads, not the facilitator. We ask basic questions station by station: what comes in, what happens here, what leaves, and what happens if this station stops for an hour. The answers get written next to each box as they come up, in whatever order the group gives them.
The ninety-minute window
Ninety minutes is not an arbitrary number. It is roughly how long it takes a group of five to eight people to walk through a line with fifteen to twenty-five stations, disagree about a couple of steps, correct the diagram, and then time the two things that matter most: how long a unit waits at each stage, and how long it is actually being worked on there.
Once those two numbers exist next to every box, the bottleneck tends to be visible without further analysis. It is usually the station where the waiting time dwarfs the working time, or the one everything else seems to be paced against, whether or not it was the station anyone suspected beforehand. In smaller operations, this pattern shows up faster than people expect. Larger, more complex lines sometimes need the full ninety minutes and a short second pass.
What this exercise does not replace
It is worth being clear about limits. A ninety-minute whiteboard session identifies where work queues up on the day it is run. It does not account for seasonal demand shifts, a supplier problem that only appears twice a year, or a machine that behaves differently after four hours of continuous run time. Those patterns need longer observation. What the exercise does reliably provide is a starting point everyone in the room agrees on, drawn in language the floor uses rather than the language of a report.
From the map to the board
Once the bottleneck is marked on the whiteboard, the natural next question is how to keep work flowing without it. This is where a Kanban board usually enters the conversation, and why we introduce it on day one rather than day two. A physical card system built around the identified bottleneck gives the team a simple rule: nothing moves past the constrained station faster than that station can actually process it. No barcode scanner is required to enforce that rule. A card, a magnet, or a marked bin does the job, because the rule is visual and the floor can see it from across the building.
A note on facilitation
We do not draw the map for the client. Our role during this session is closer to asking the next question than holding the marker. Some groups move quickly and finish with time to spare. Others get stuck disagreeing about a station's actual cycle time, which is itself useful information, since it usually means nobody has measured it directly before.